Great Lakes Buoys Status Tracker

Humboldt Capture Query Tool
Field Trip Visualization Tool
IPHC Statistical Harvest Data
Grand Staircase - Escalante National Monument Live Weather
Featured Geospatial Applications
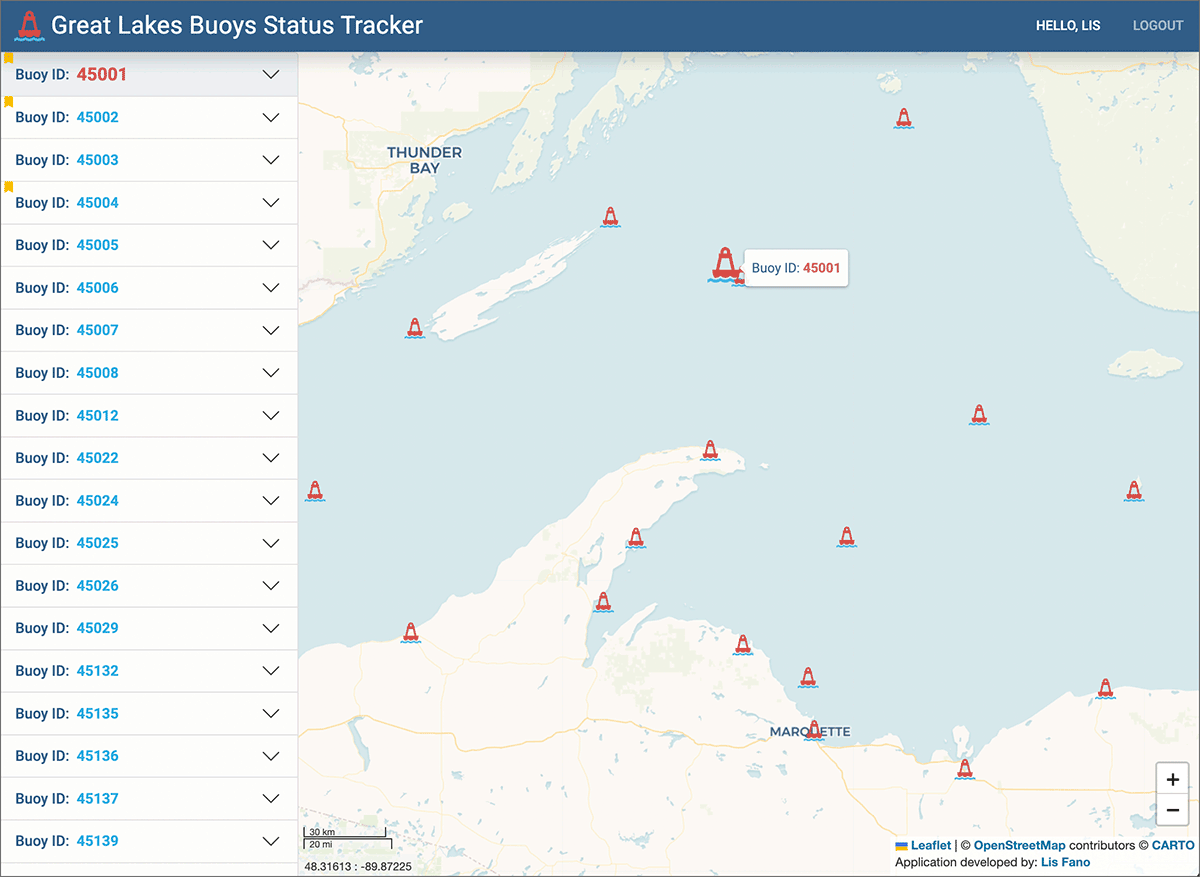
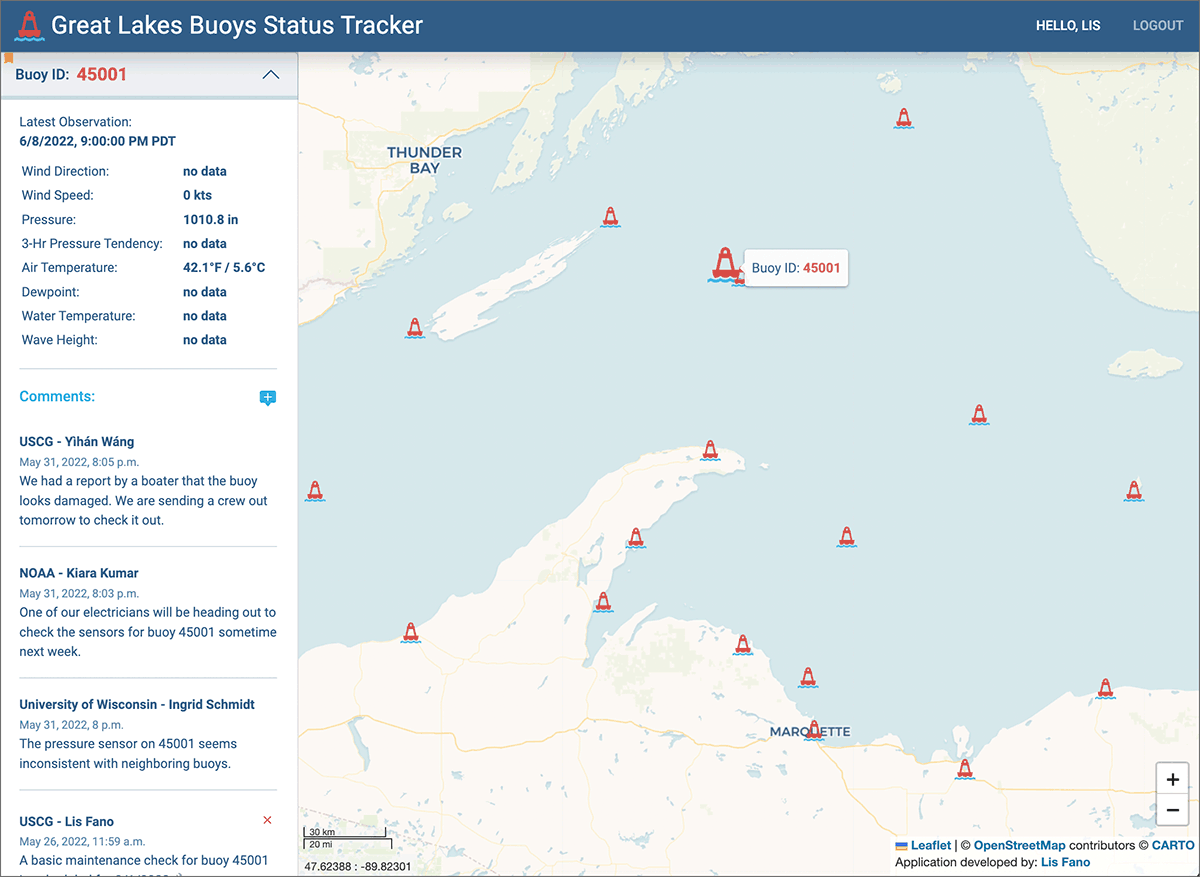
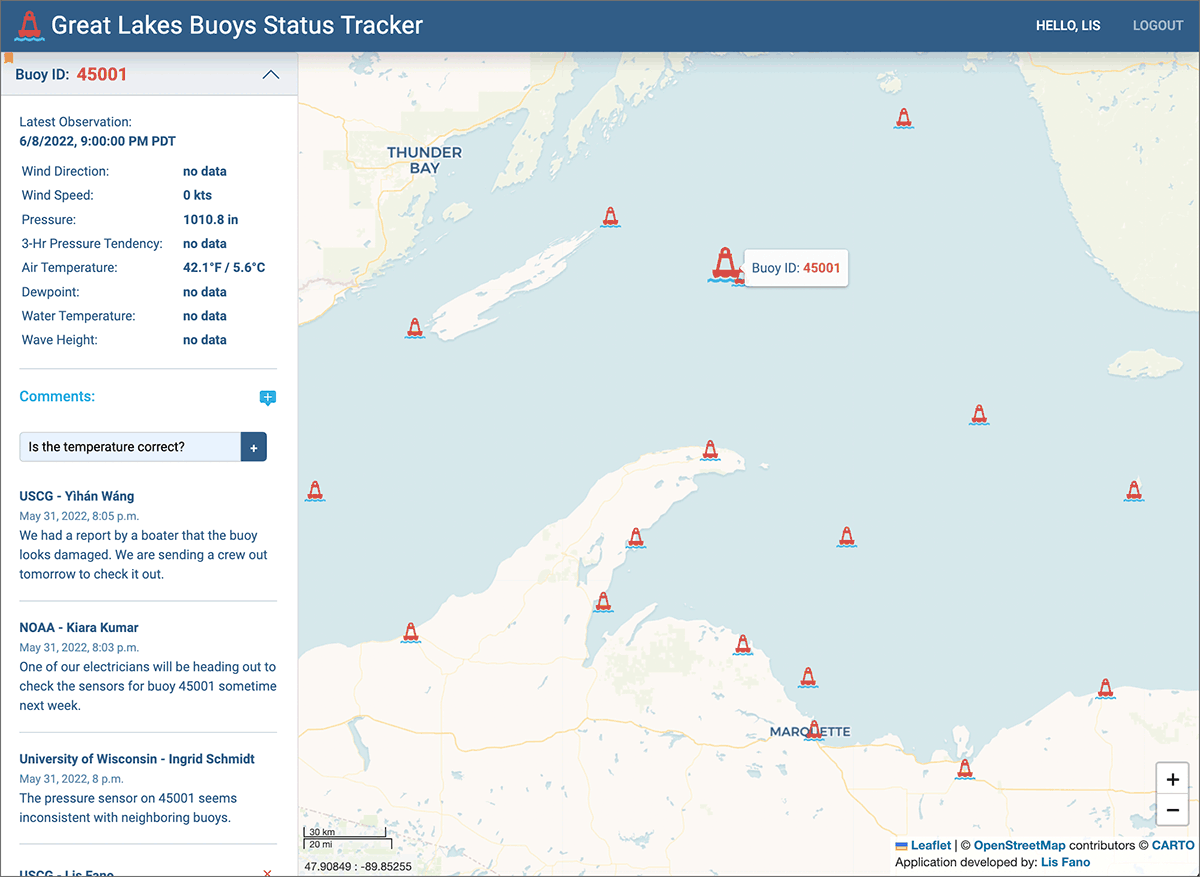
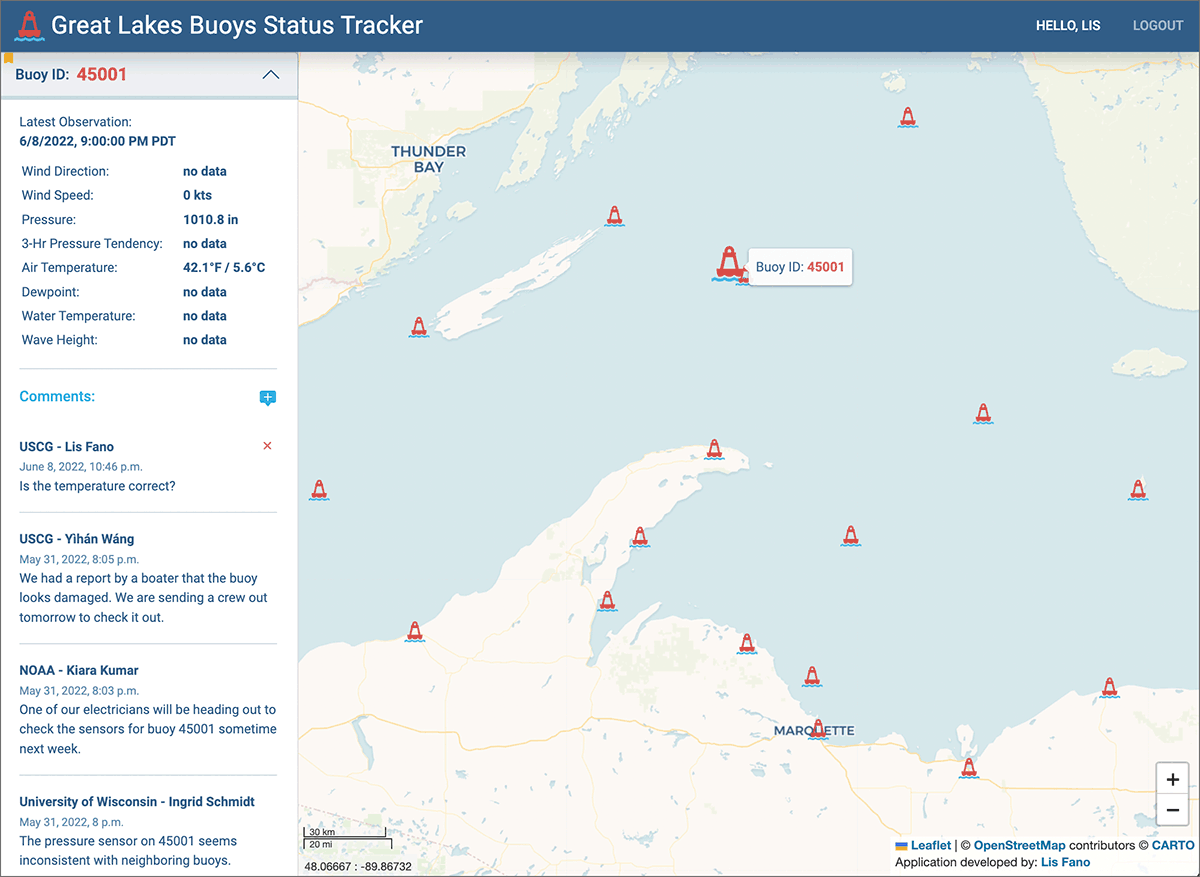
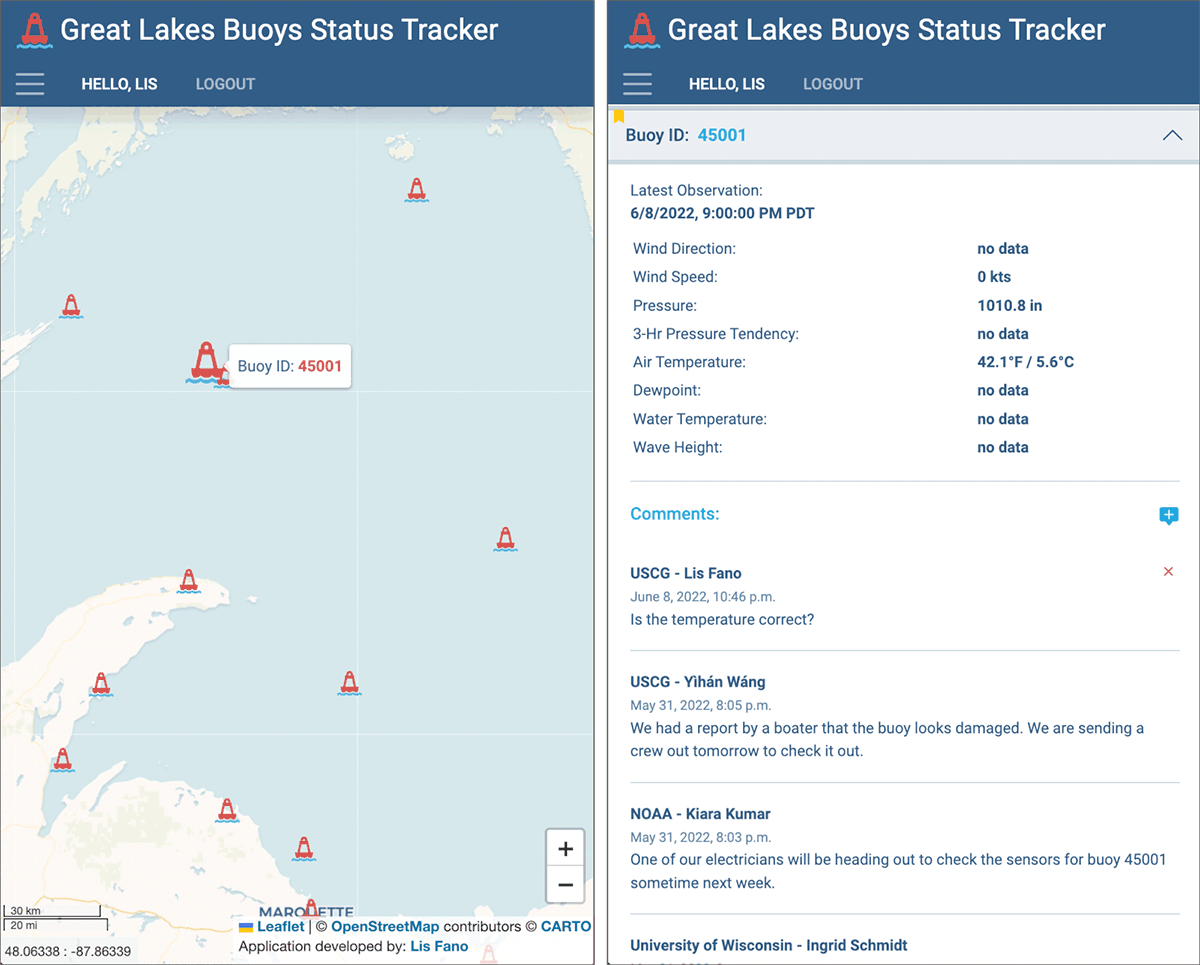
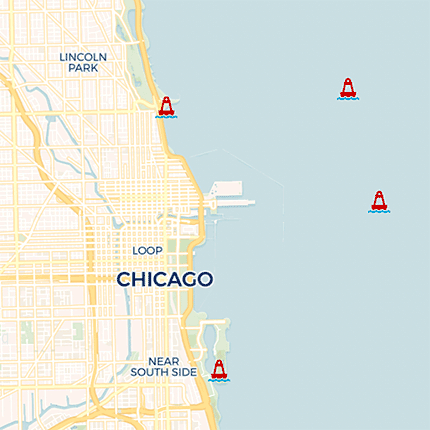
Great Lakes Buoys Status Tracker
The Great Lakes Buoys Status Tracker application is designed to provide an interactive web experience that visualizes the current buoy location within the Great Lakes region, realtime sensor data access, and a comment thread interface that is editable by a logged-in user. The premise of this projects is a concept study of how multiple agencies could quickly access realtime data that could indicate instrument sensor issues, as well as a medium of sharing maintenance and transportation scheduling. This full-stack application was built using the Django framework and an SQLite database. The code for this web application can be viewed on GitHub.
Languages: Python, JavaScript, HTML, CSS
Libraries: Leaflet, jQuery, Bootstrap
Data Sources:
University Corporation for Atmospheric Research (UCAR)'s
THREDDS data server
Our Vanishing Glaciers
Winner (tie) of the 2020 NACIS Individual Student Dynamic Mapping Competition!
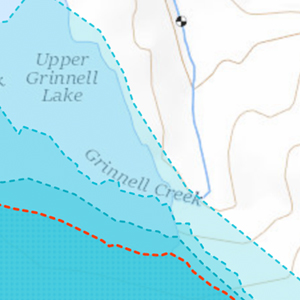
Over 150 alpine glaciers existed in
Glacier National Park, Montana (NPS) at the end of the Little Ice Age. In 1966, the park had
35 named glaciers large enough to be considered active. By
2015, only 26 of those glaciers remained. The
United States Geological Survey (USGS) has been documenting glacial area loss since 1966.
This web mapping project integrates these digitized glacier areas, displays them interactively, and
combines them with local climate data. The application is designed to provide an interactive web
experience that visualizes the decrease in
glacier extent over time. The code for this web map can be
viewed on GitHub.
Languages: JavaScript, Python, HTML, CSS
Libraries: Leaflet, D3.js, jQuery, Assembly.css
Data Sources: USGS,
NPS, Portland State University,
Oregon State University Parameter-elevation
Regressions on Independent Slopes Model (PRISM)
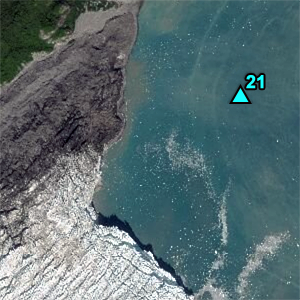
CTD Profile Measurements
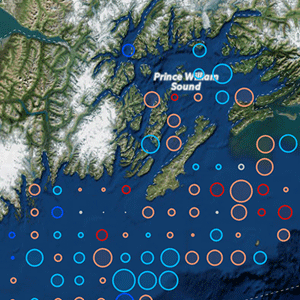
Glacier Bay National Park and Preserve's oceanography program consists of 22 permanent monitoring stations that measure standard oceanographic parameters throughout the water column: temperature, salinity, pressure (depth), photosynthetically active radiation (PAR - light penetration from the surface), optical backscatterance (turbidity), dissolved oxygen concentration, and fluorescence (proxy for chlorophyll-a concentration). Relying heavily on the D3.js library, this web application quickly queries each station by sampling date and data type, allowing users to easily compare monthly, seasonal, and inter-annual variances and profile data trends. The code for this web map can be viewed on GitHub.
Languages: JavaScript, Python, HTML, CSS
Libraries: Leaflet, D3.js, jQuery, Assembly.css
Data Sources: NPS
Southeast Alaska Inventory & Monitoring Network
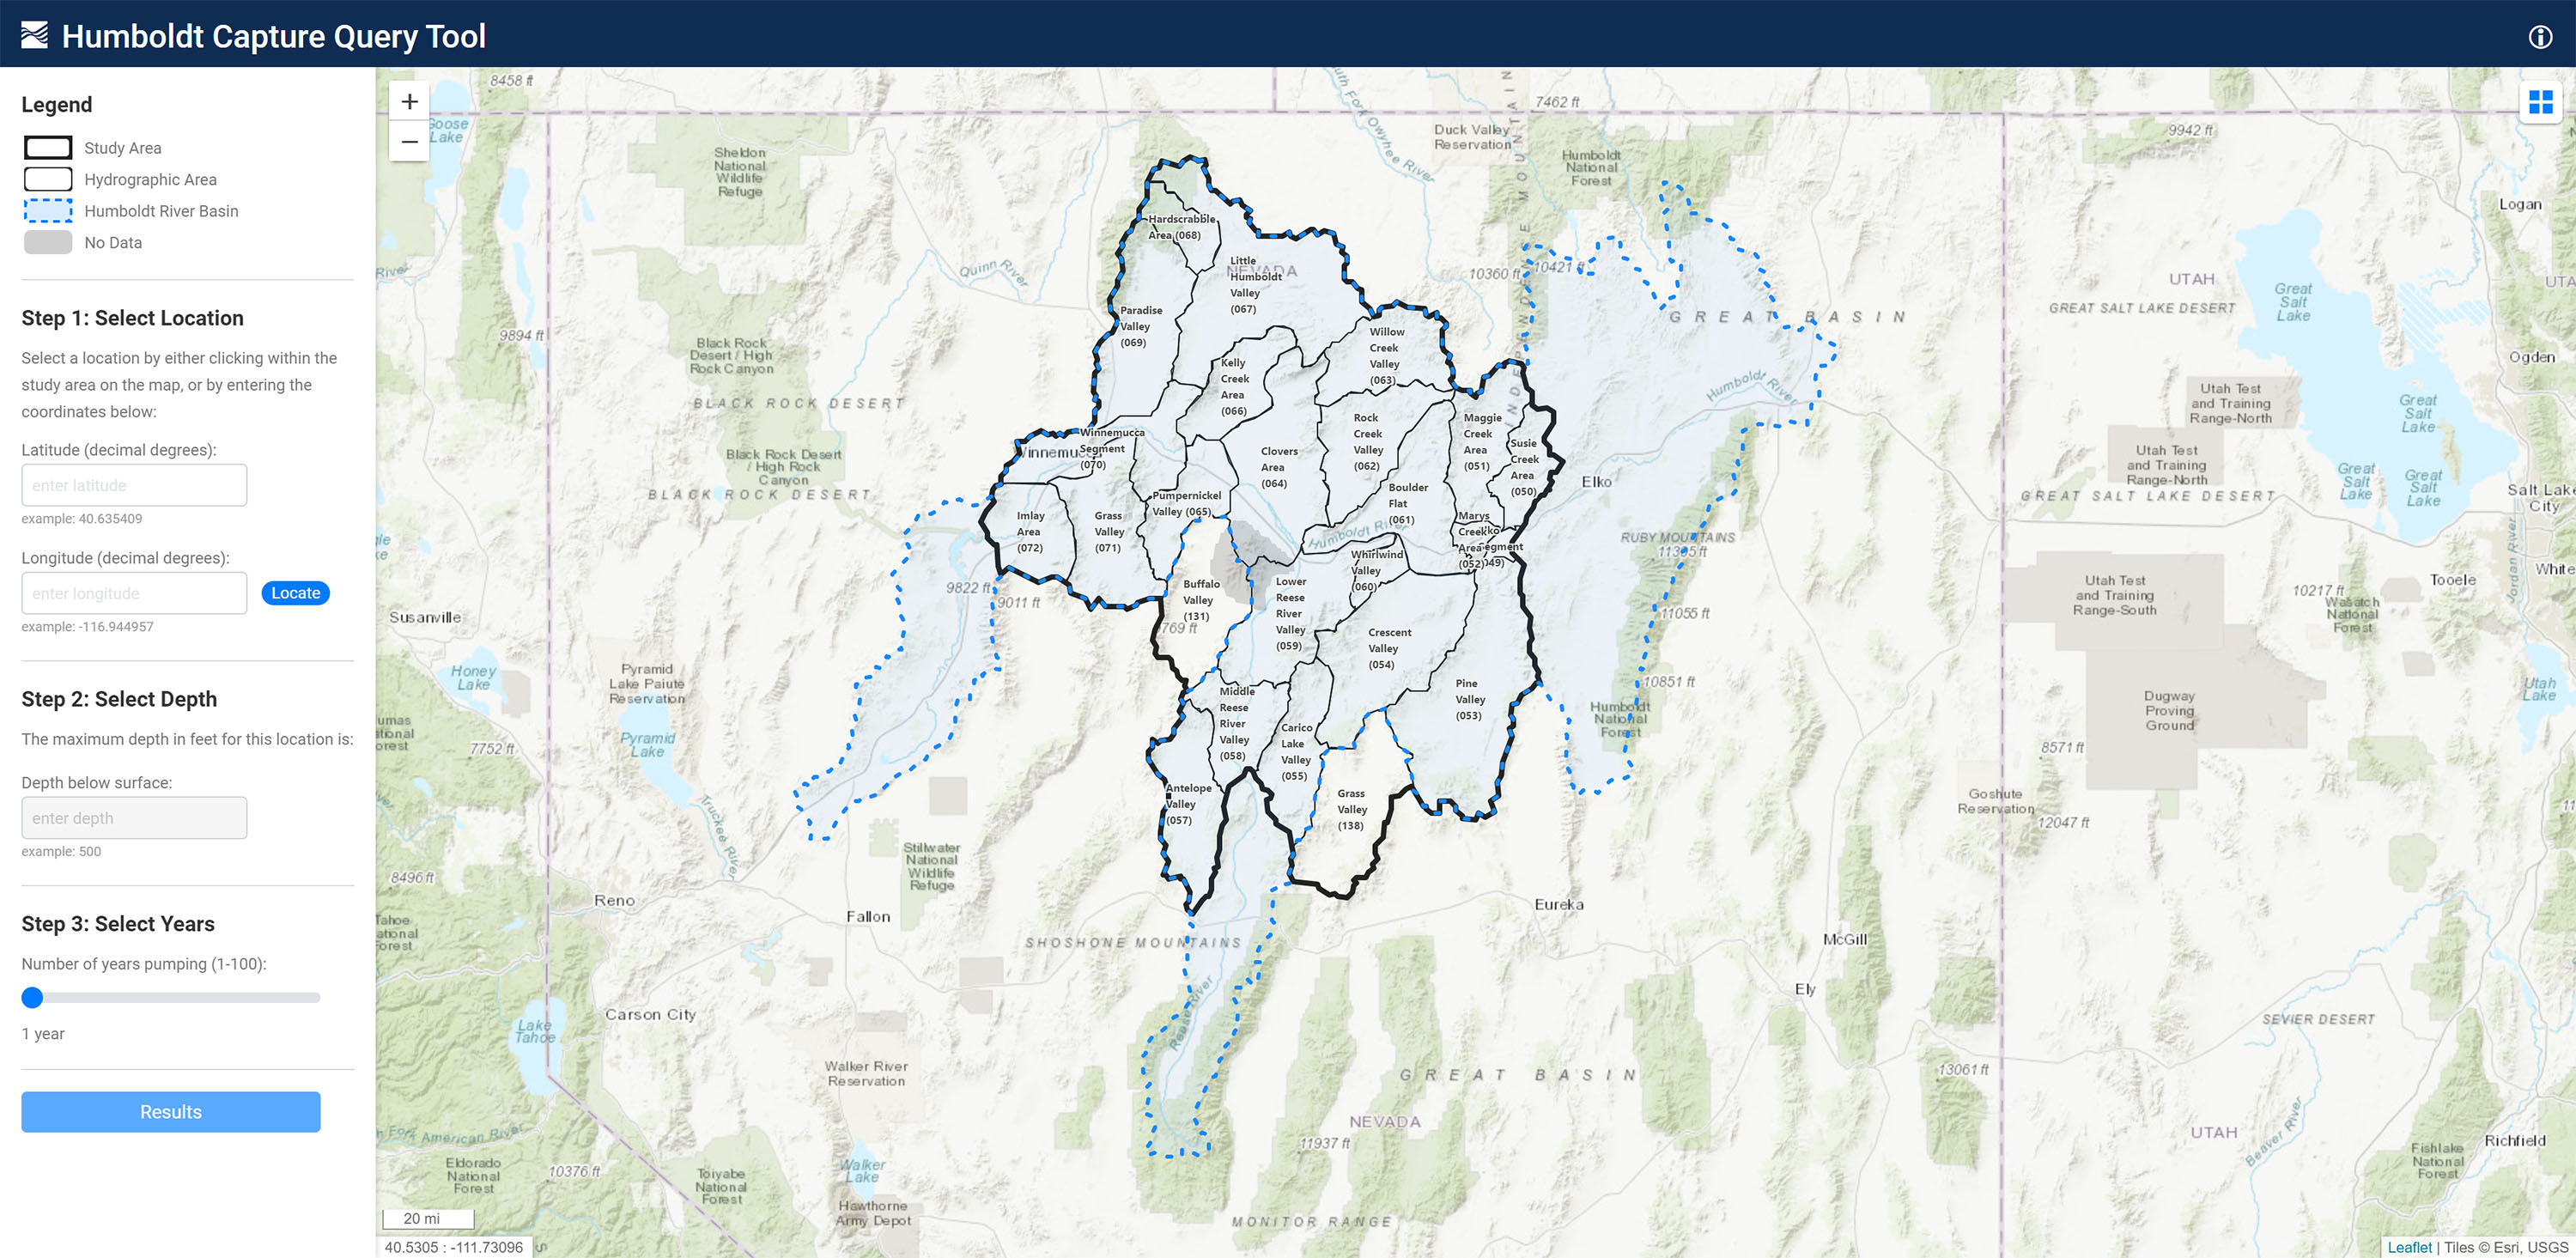
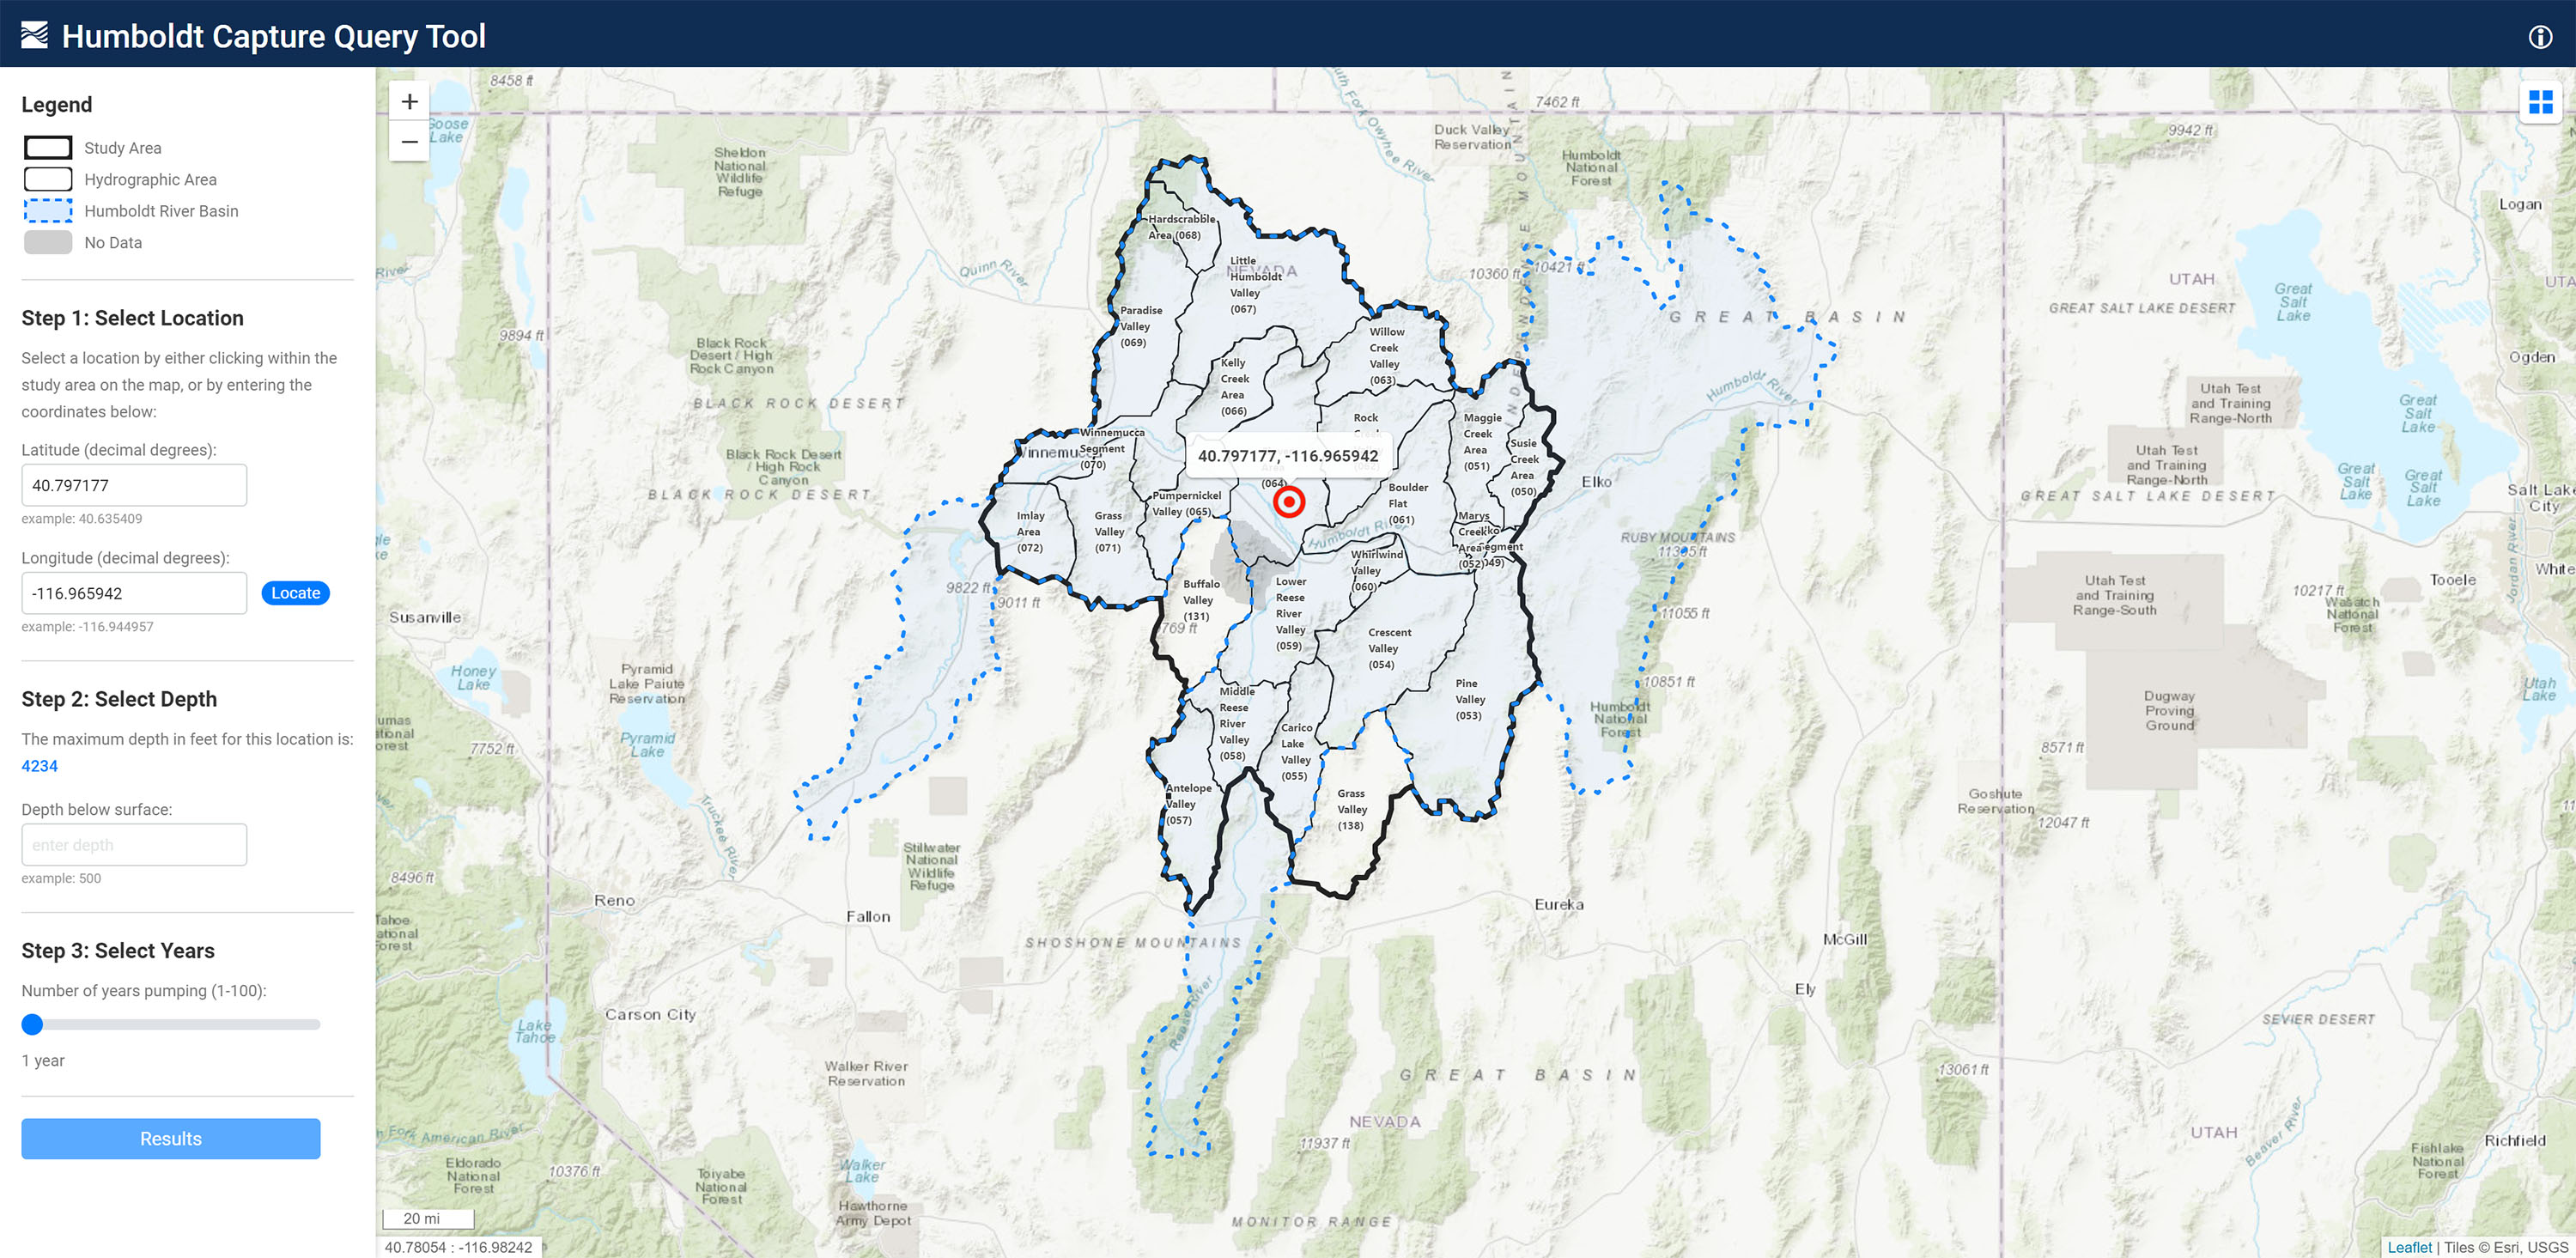
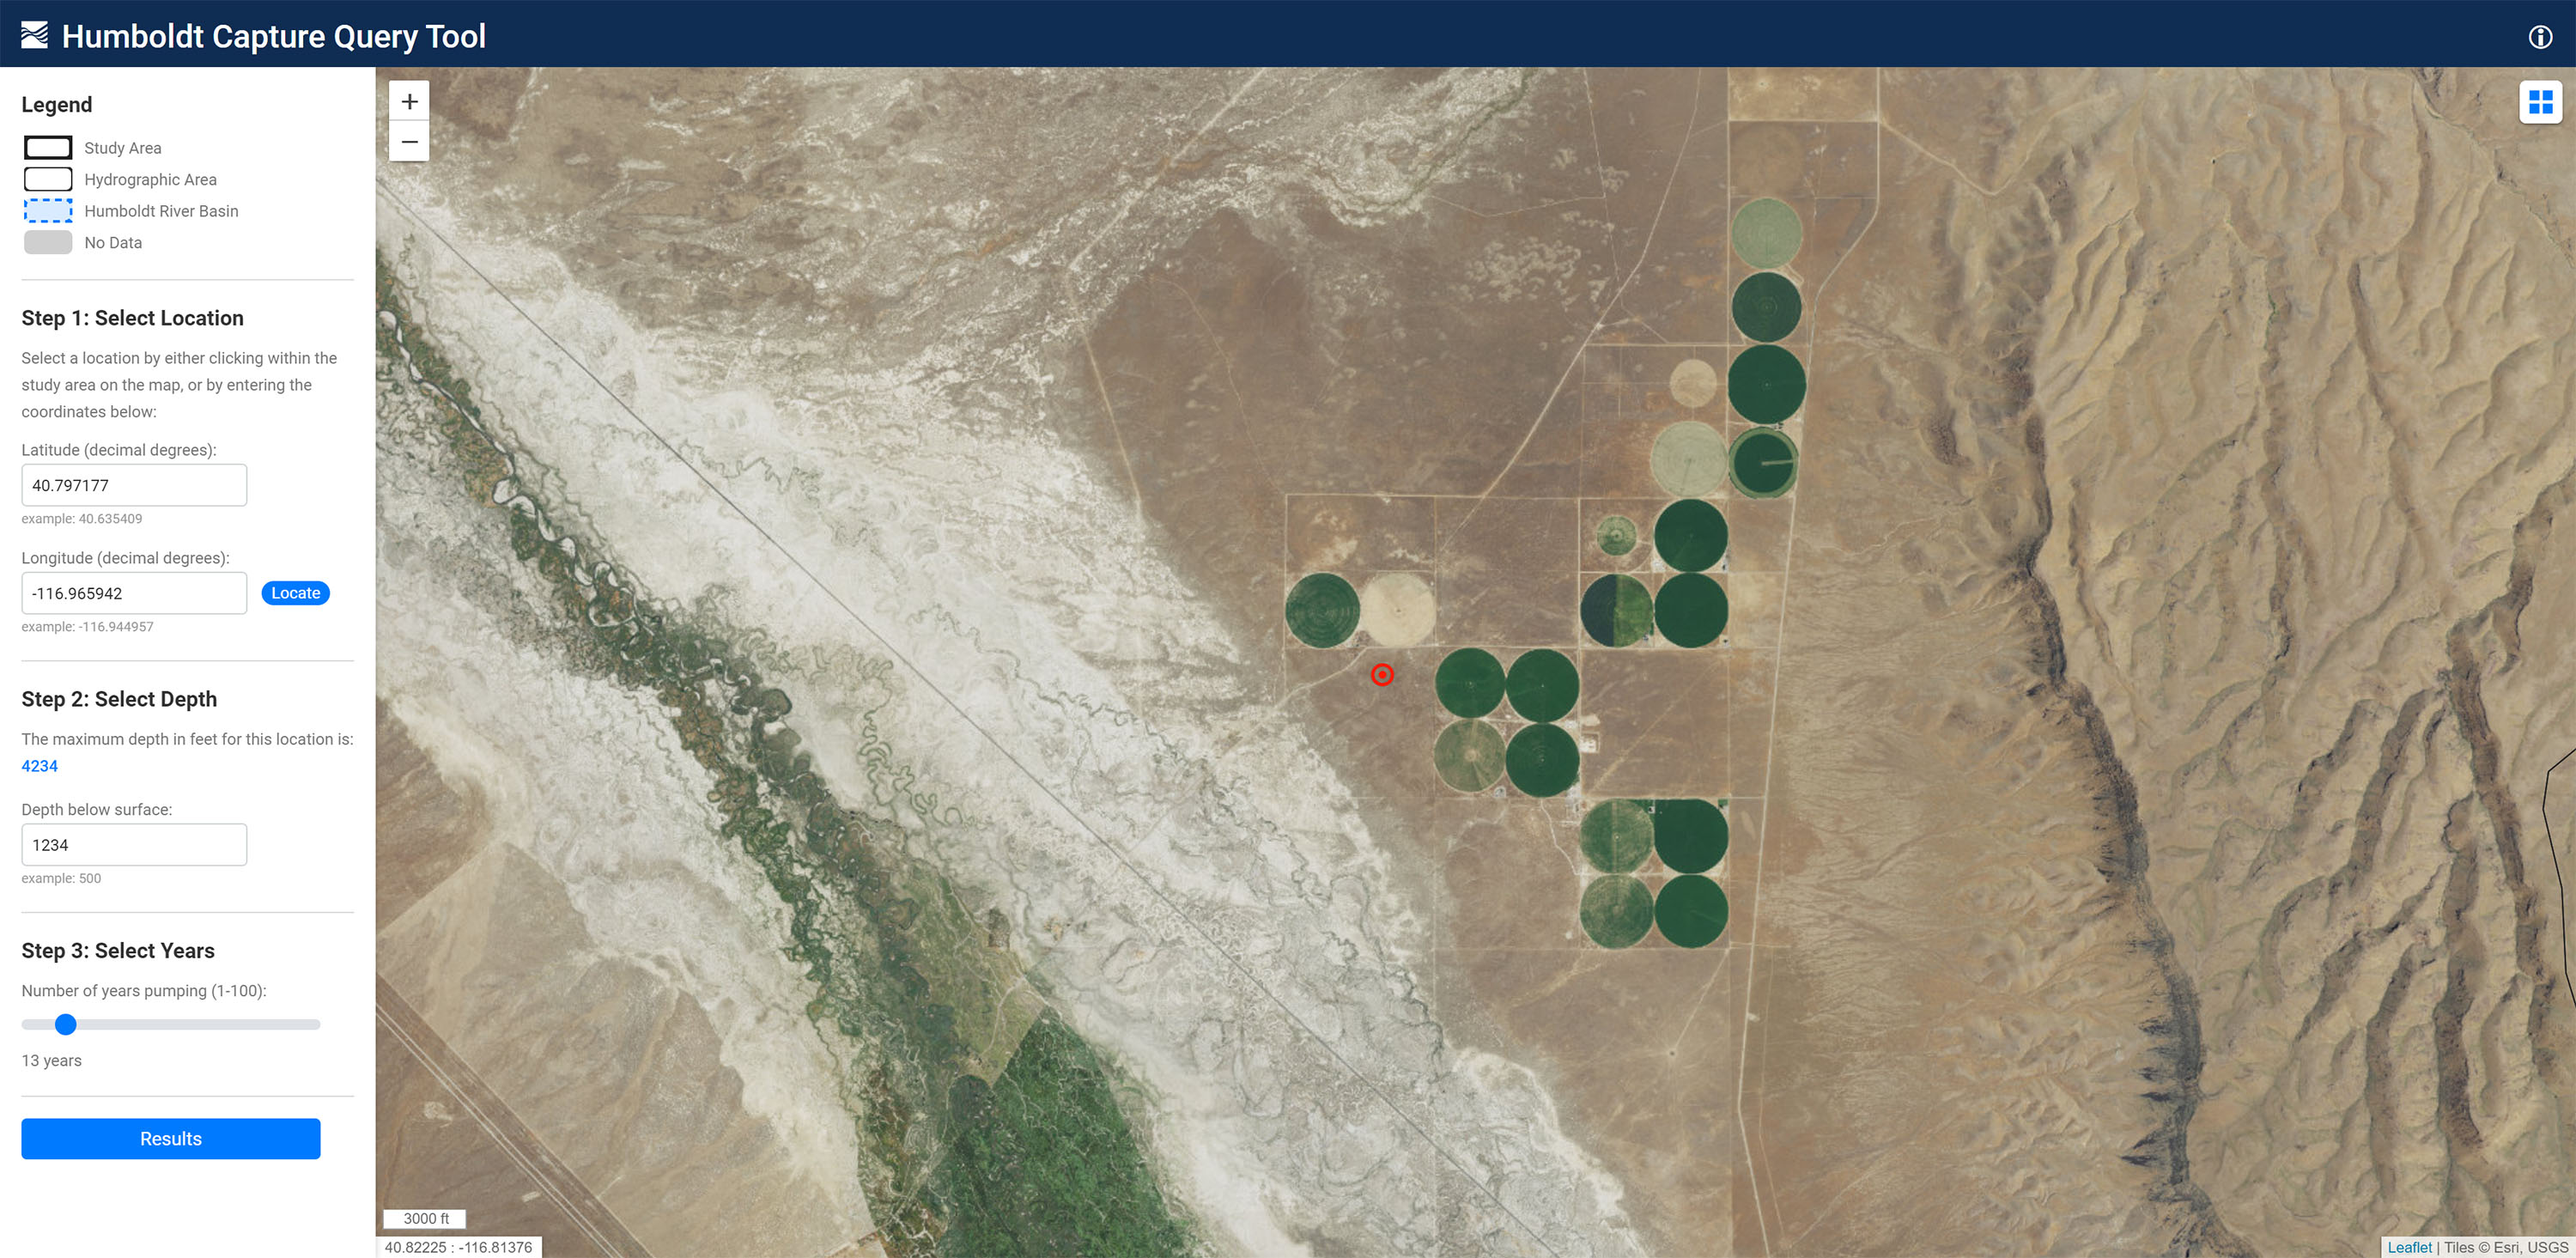
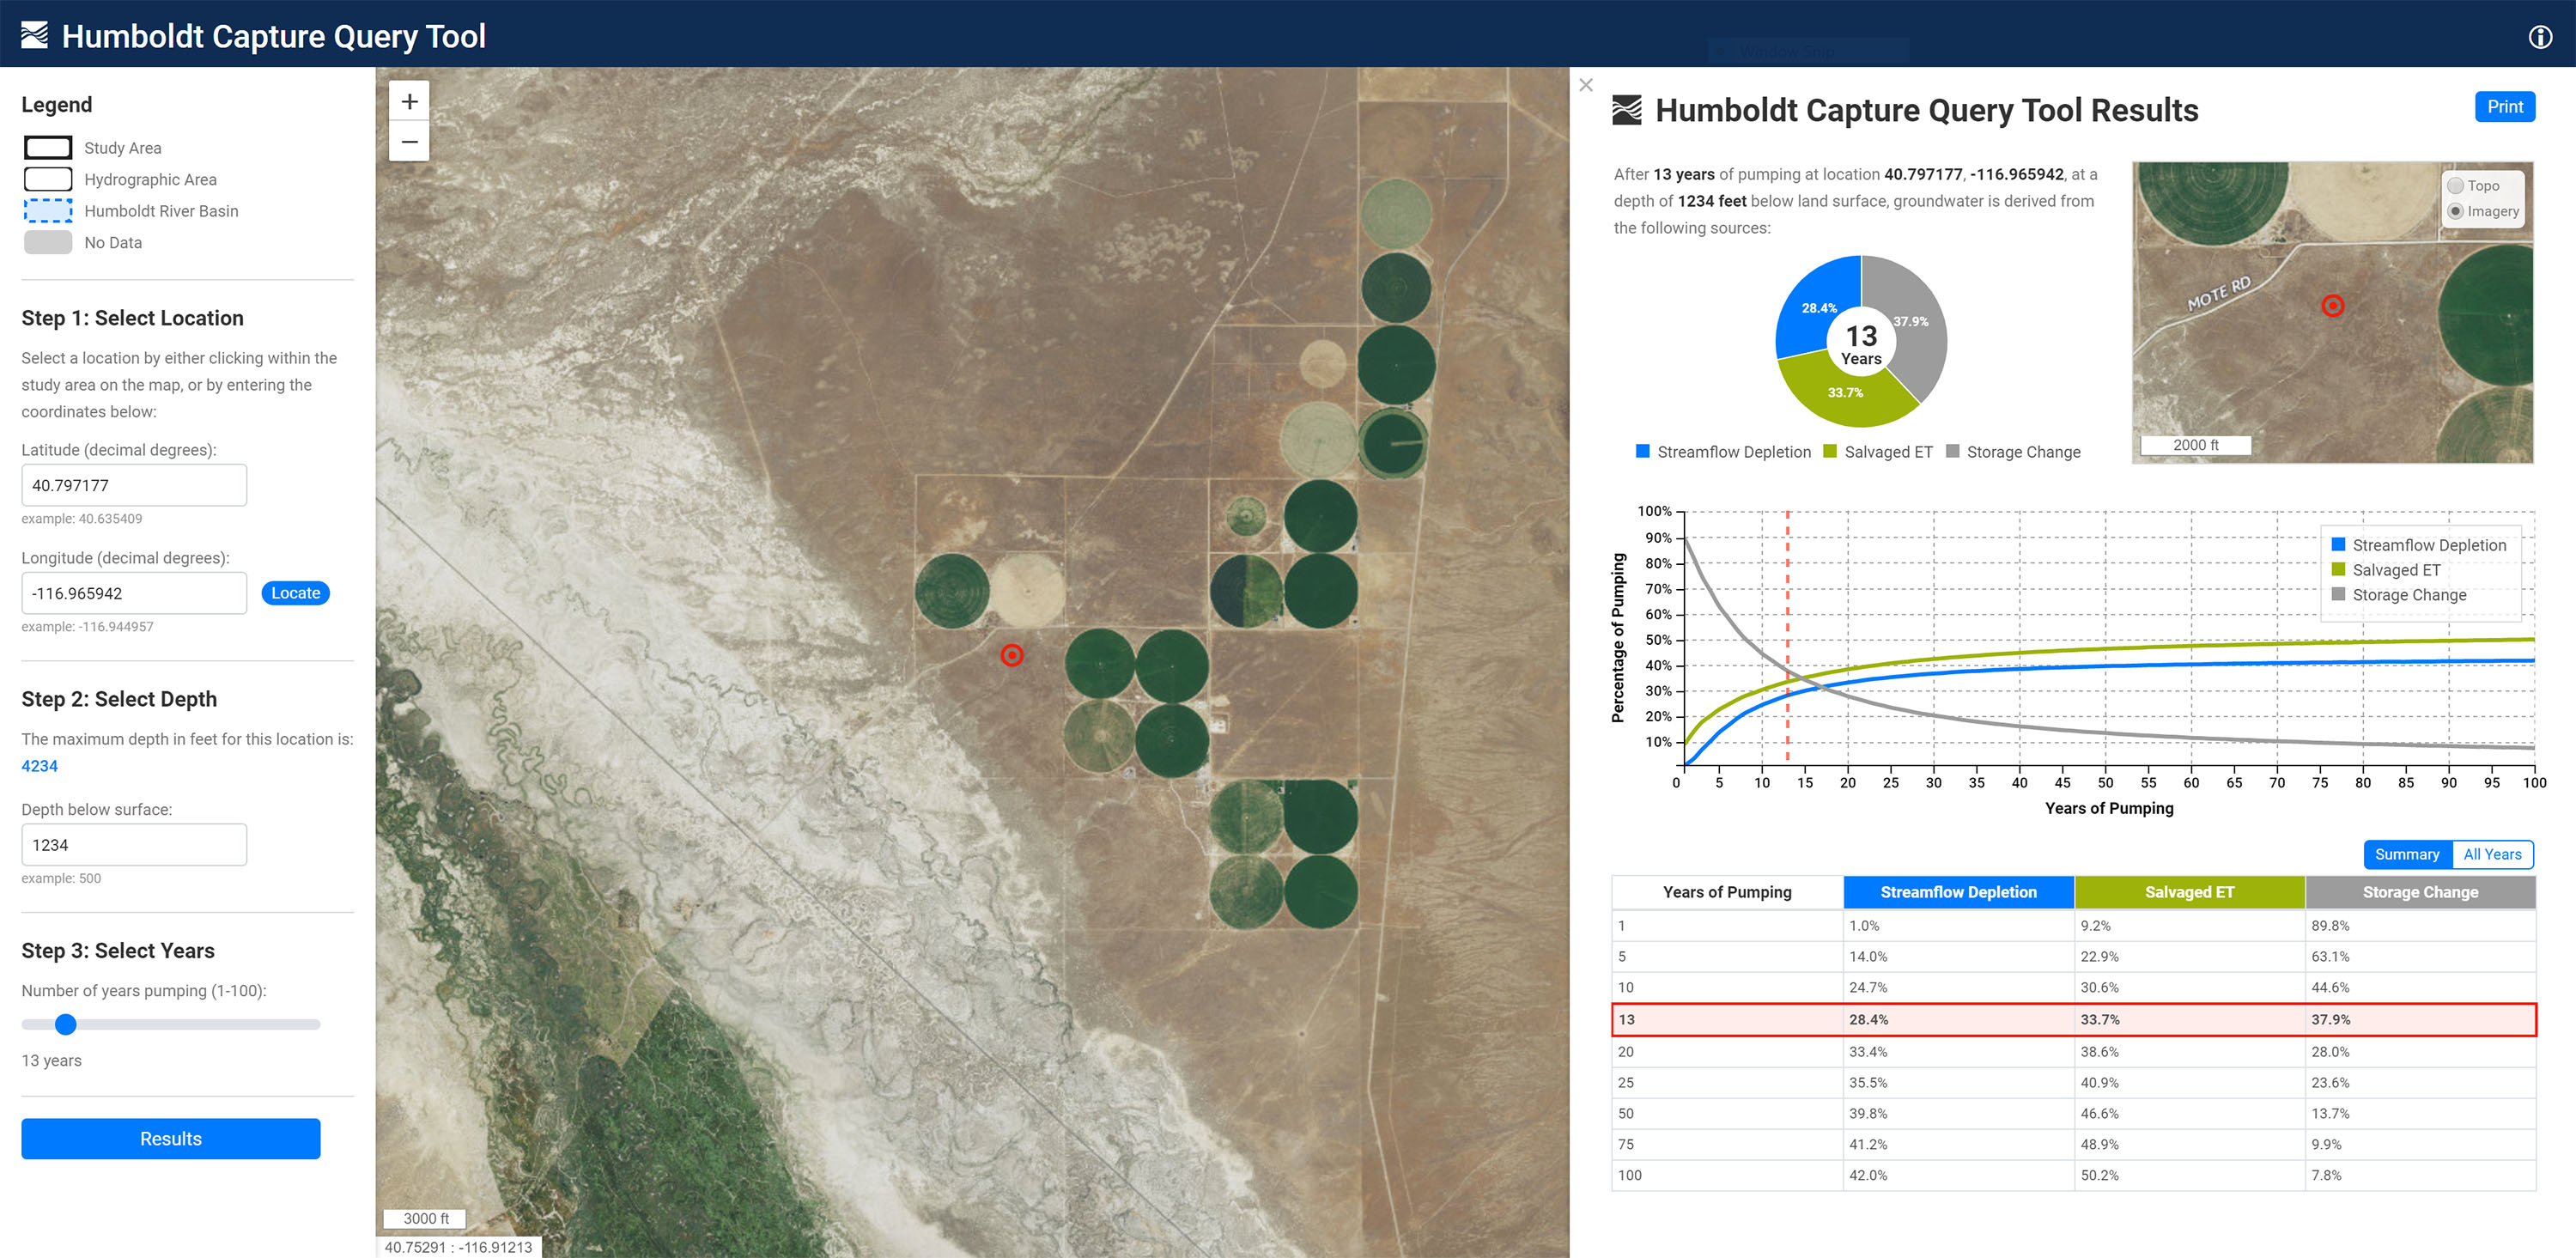
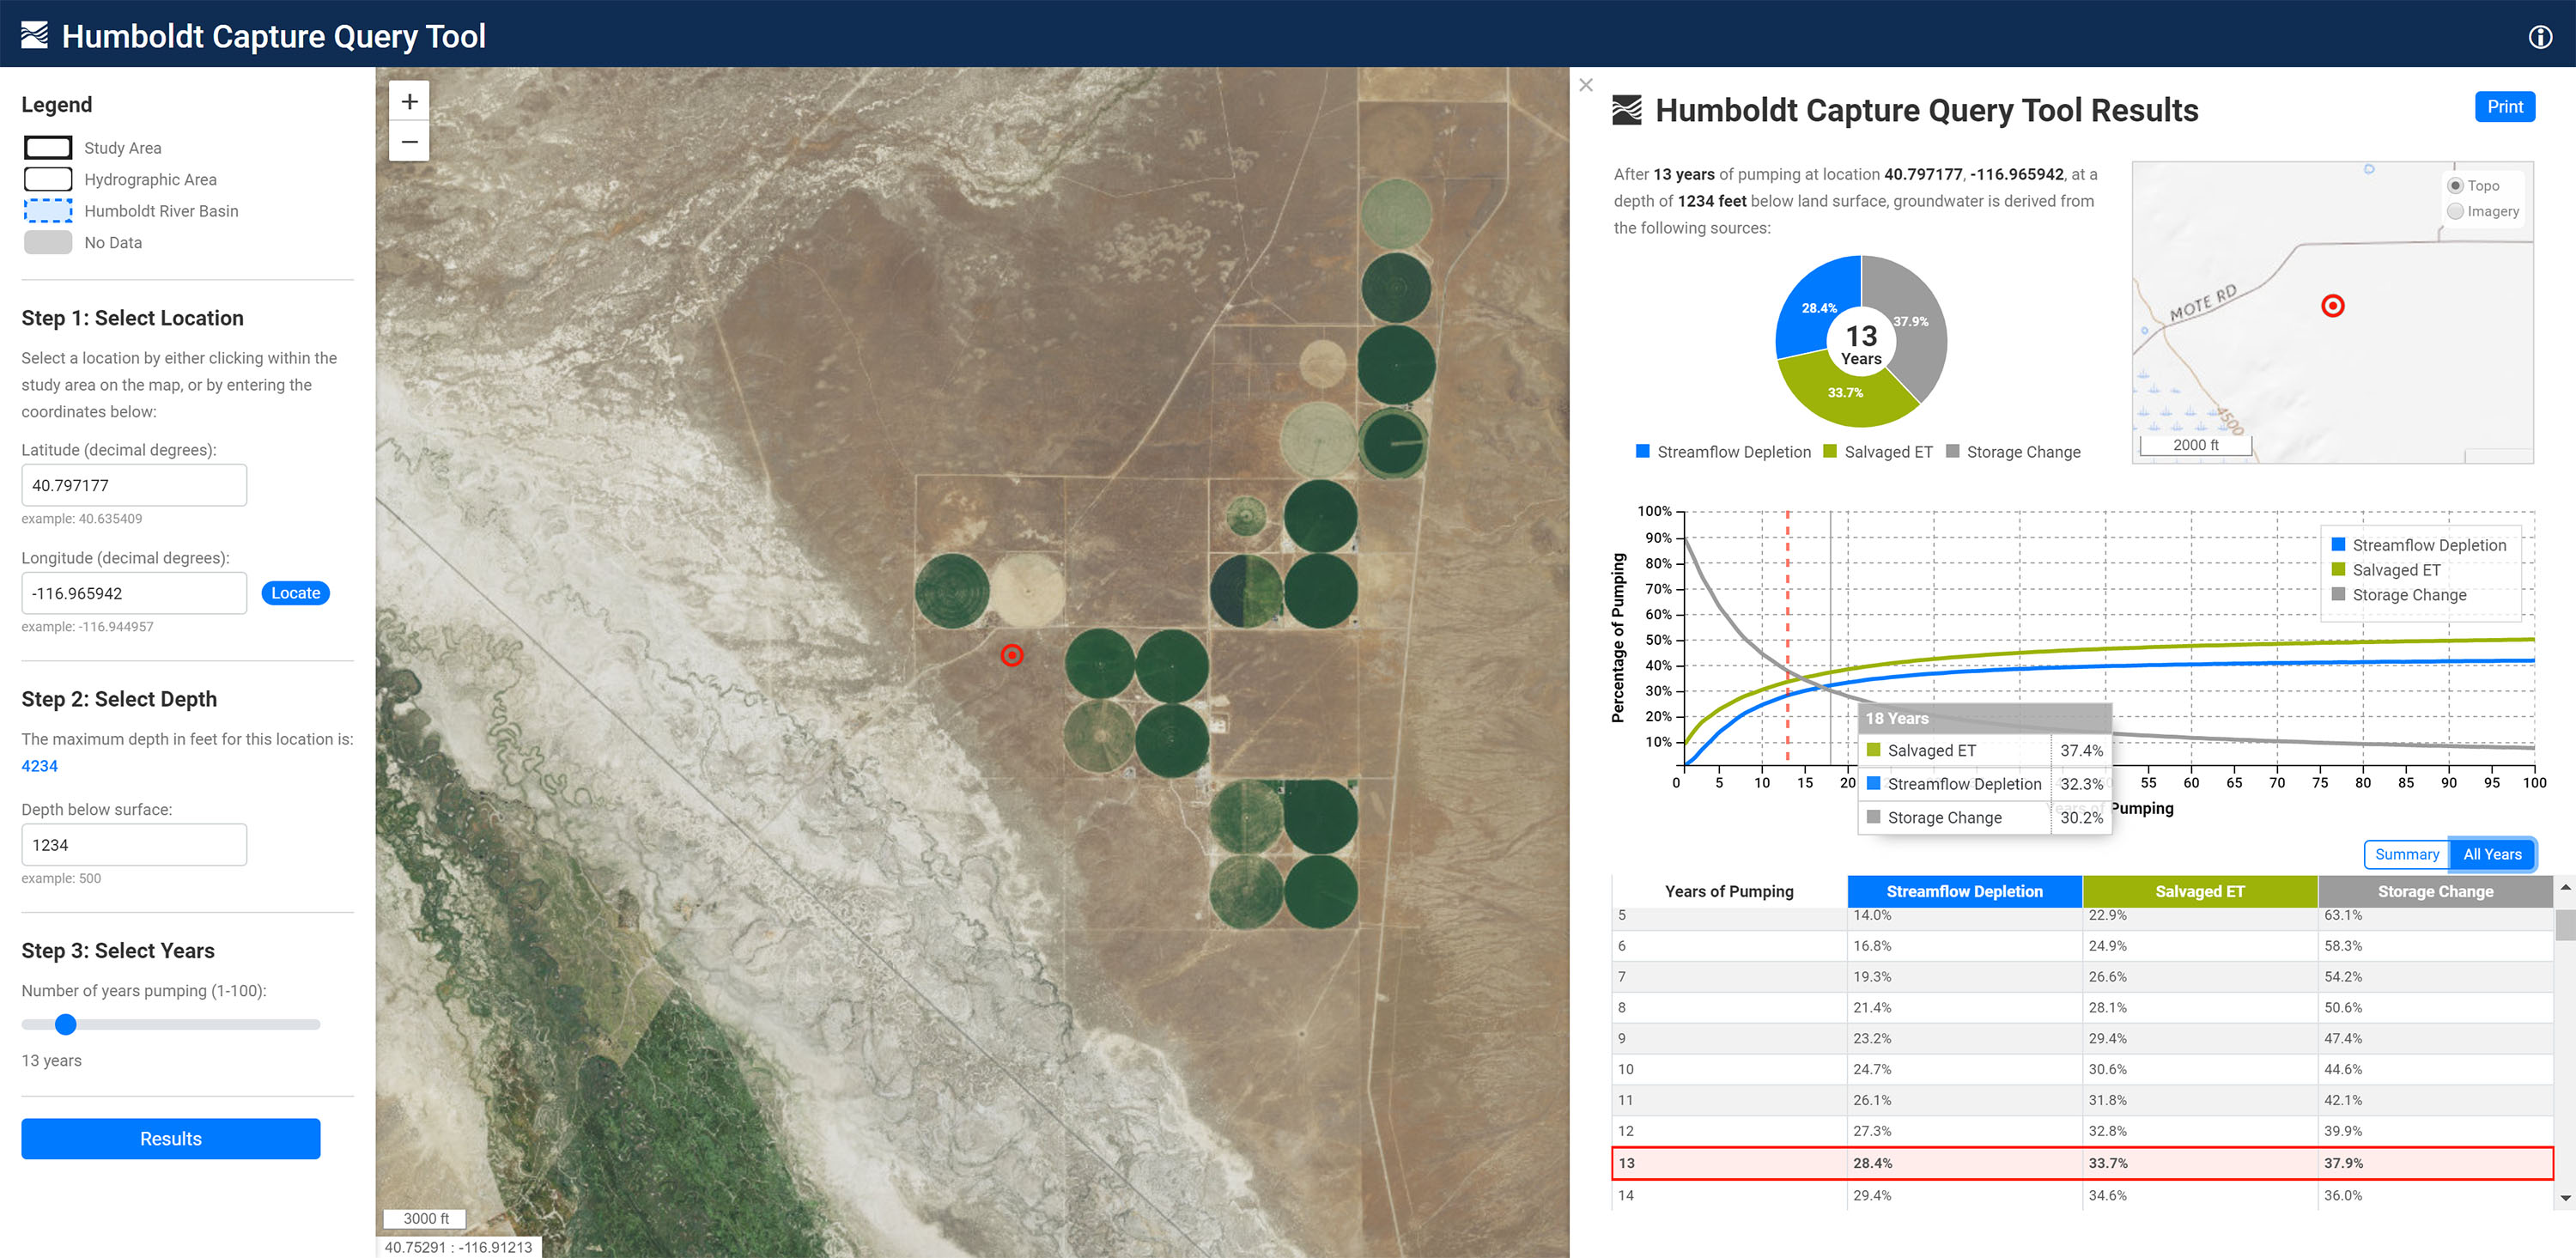
Humboldt Capture Query Tool
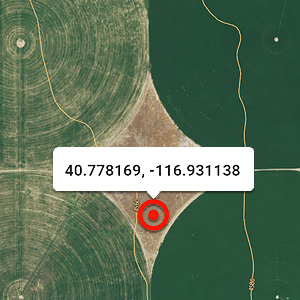
The Humboldt Capture Query Tool was developed as part of a USGS research project to visualize modeled location-based groundwater depletion within Nevada's Humboldt River Basin. The interactive, 3-step tool provides the Nevada State Engineer and stakeholders the information needed to understand and evaluate the potential effects of groundwater withdrawals within the basin and processes related to the interaction between groundwater and surface water.
Languages: JavaScript, HTML, CSS, SQL
Libraries: Leaflet, D3.js, C3.js, Node.js, Express, Turf.js, jQuery, Bootstrap
Data Sources: USGS
Nevada Water Science Center
IPHC Setline Surveys
The International Pacific Halibut Commission (IPHC) conducts annual surveys that collect standardized data used for halibut stock assessment. This interactive web map displays the station locations and regulatory areas where the annual setline surveys occur. The data used in this exploratory analysis are from 1998 through 2015, and include total count and weight of fish at each survey station. The code for this web map can be viewed on GitHub.
Languages: JavaScript, HTML, CSS
Libraries: Mapbox, Leaflet, jQuery
Data Sources: International Pacific
Halibut Commission
Fatal Journeys
2019 CaGIS Digital Map Honorable Mention!
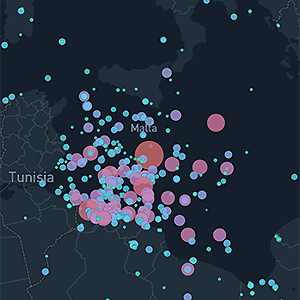
Every year, hundreds of thousands of people leave their homes in search of a better life. Many are
injured or killed, while many more go missing. The U.N.’s
International Organization for Migration's (IOM) Missing Migrants Project tracks incidents
involving migrants, including refugees and asylum-seekers, who have died or gone missing in the
process of migration towards an international
destination. The code for this web map can be
viewed on GitHub.
Languages: JavaScript, HTML, CSS
Libraries: Mapbox GL JS, D3.js, Turf.js, Assembly.css
Data Sources: Missing
Migrant Project
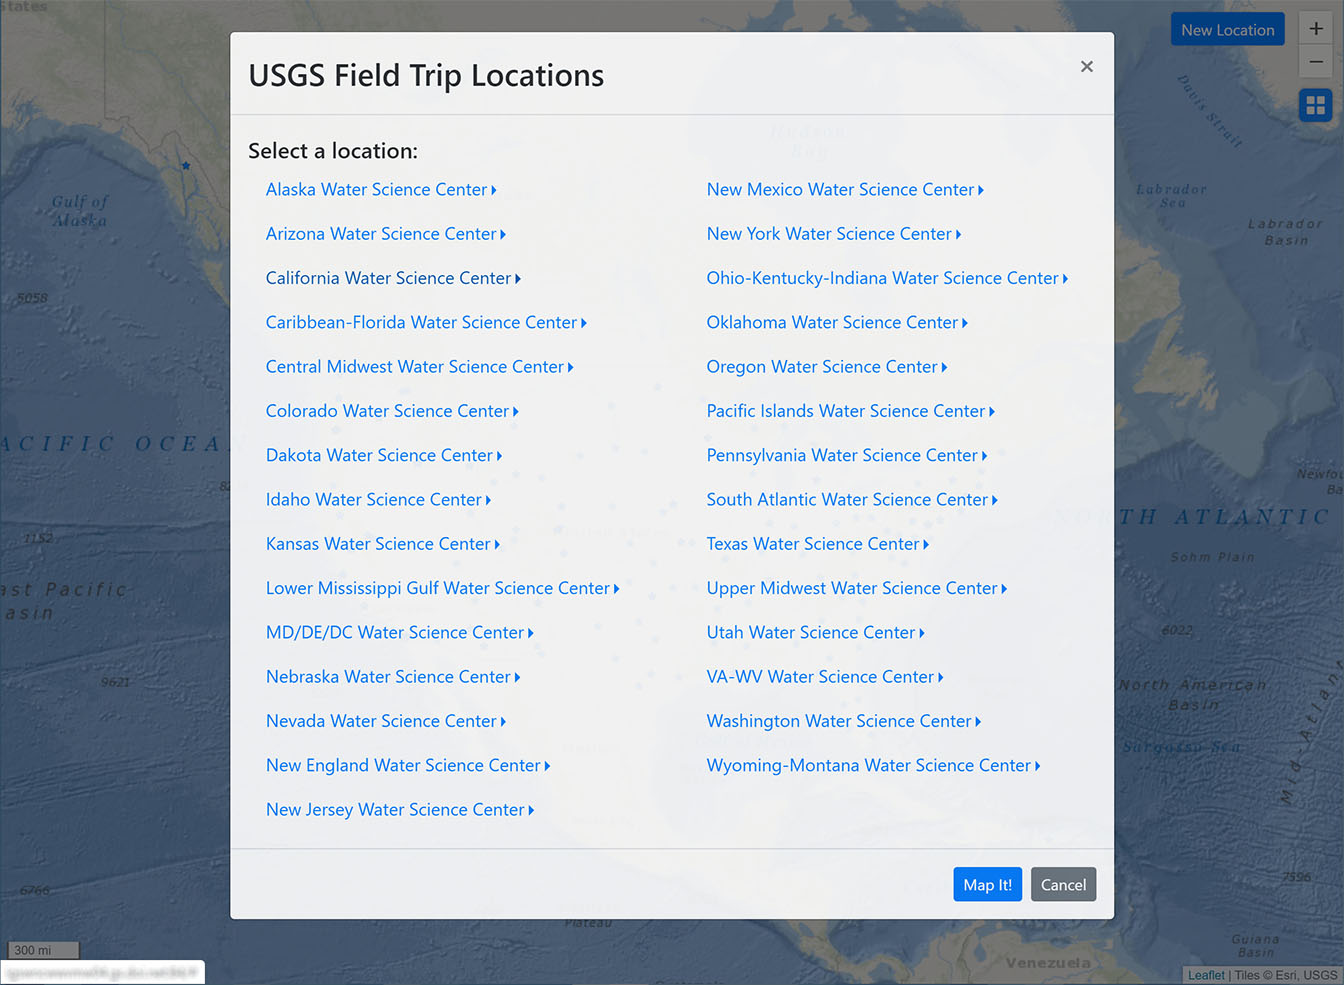
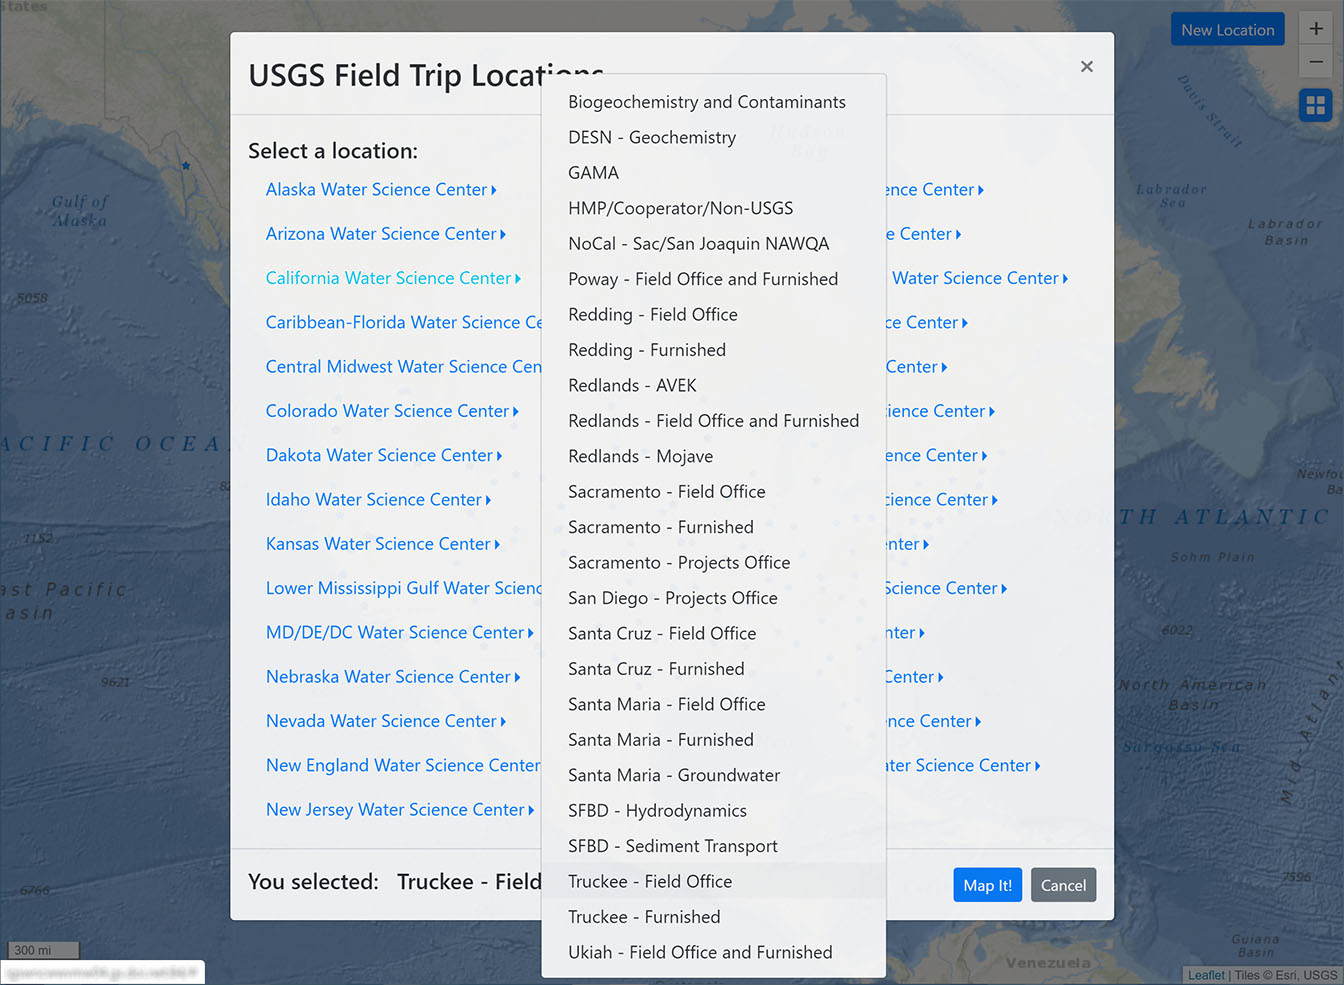
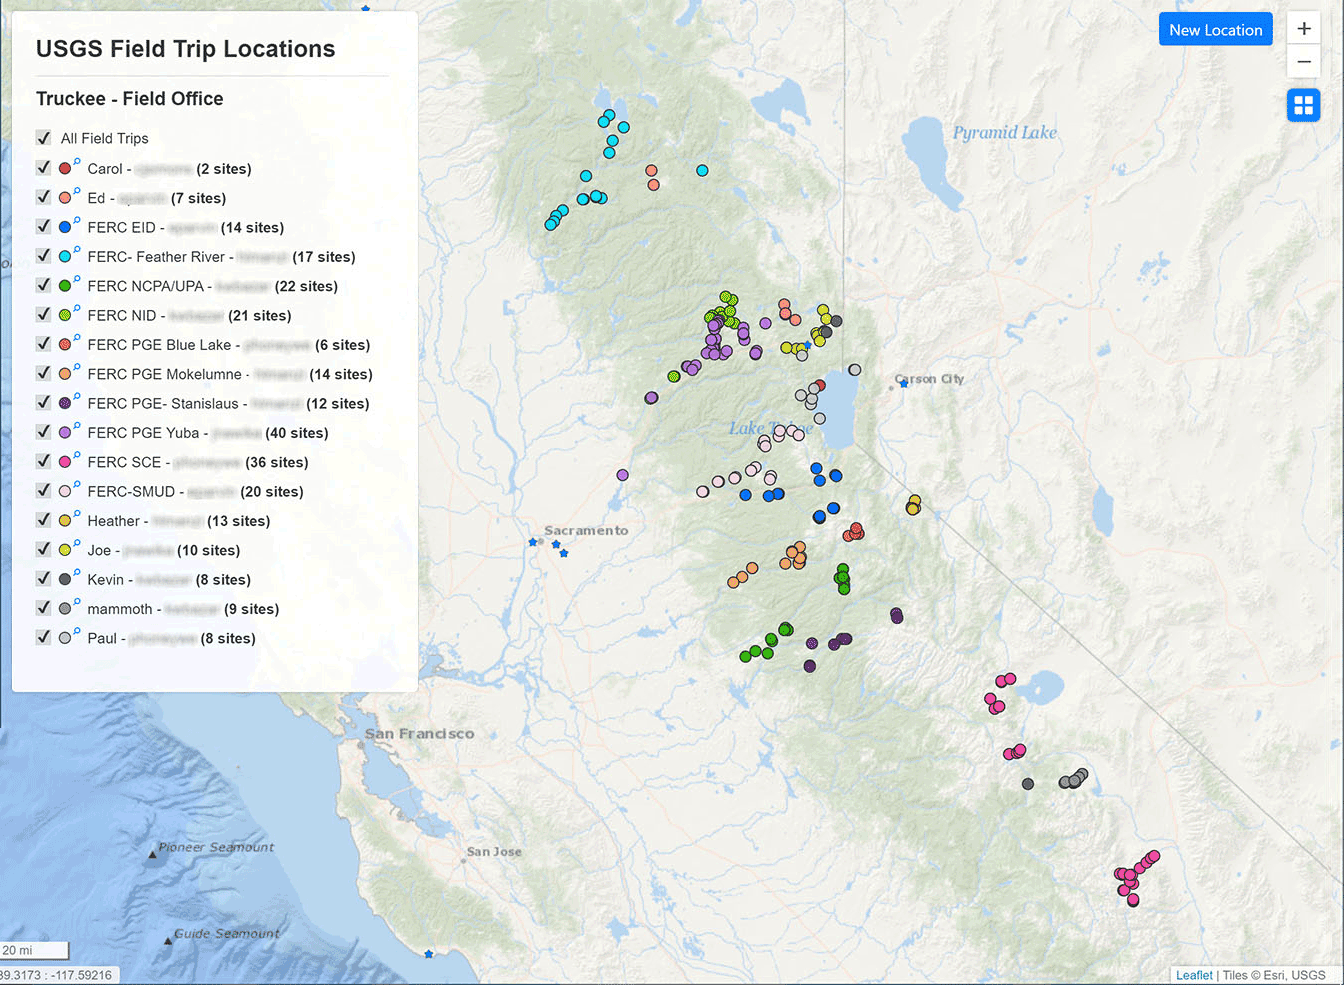
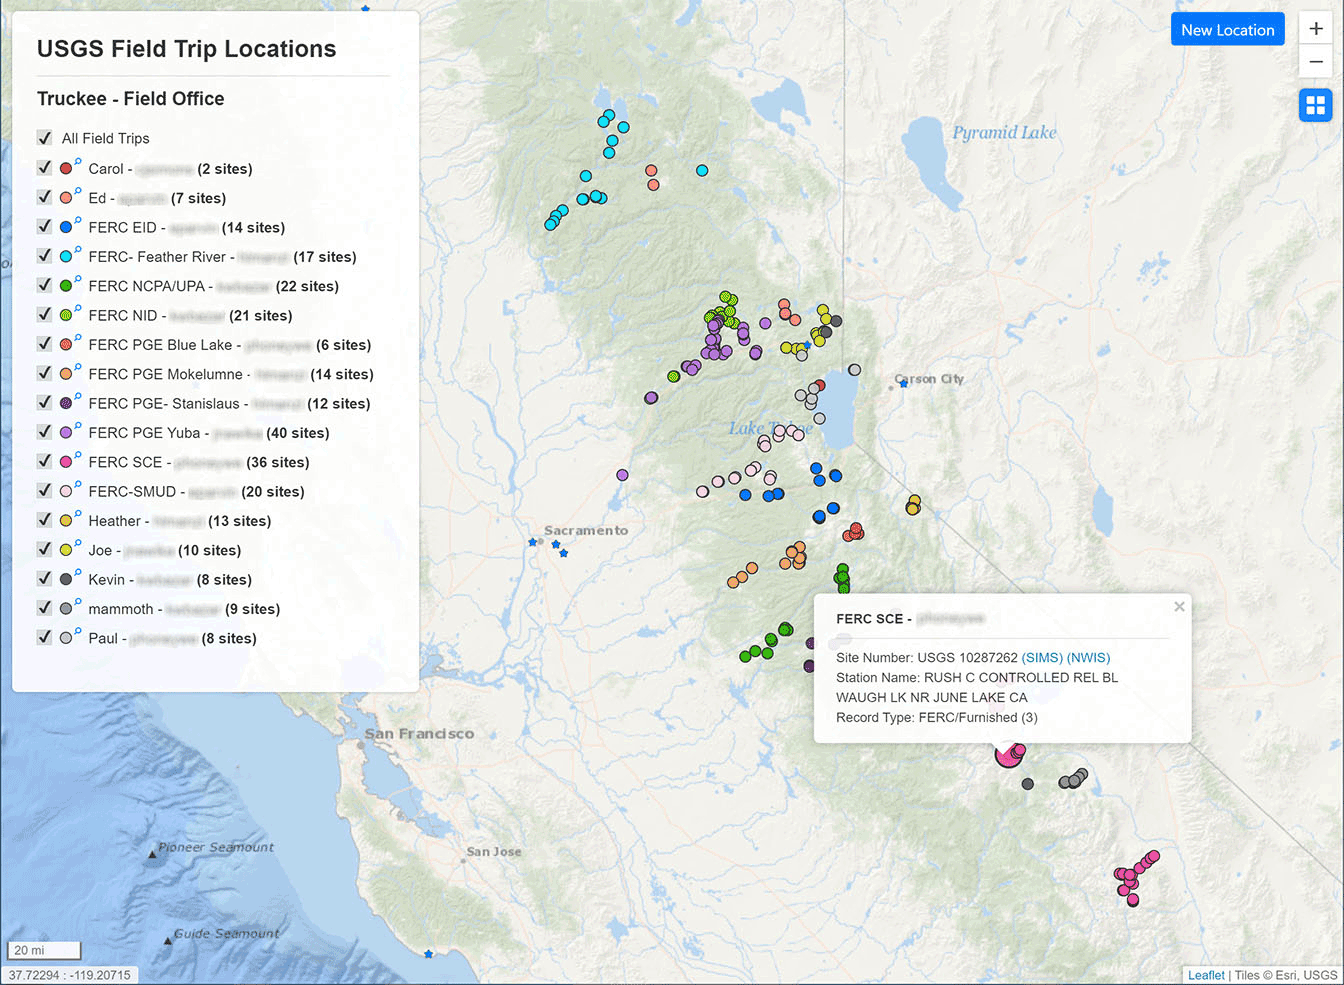
Field Trip Visualization Tool
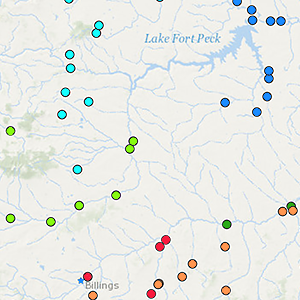
The Field Trip Visualization Tool is a nationwide, internal USGS application designed to assist managers and employees in field trip planning. The tool queries data from a national database via multiple APIs and filters and aggregates site locations by field office. Site locations are color-coded by field trip, and selectable through the use of an interactive legend. A site location popup links to additional websites for convientent access to additional, detailed site information.
Languages: JavaScript, HTML, CSS
Libraries: Leaflet, jQuery, Bootstrap, Lodash
Data Sources: USGS
Nevada Water Science Center
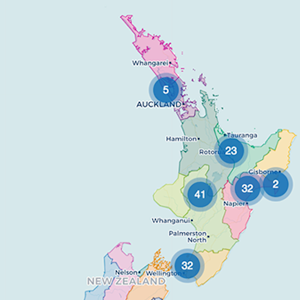
Invasive Flora Species
Node.js is an open-source, JavaScript framework that executes JavaScript code outside of a browser. This project uses Node and npm to load and process data including reading, parsing and writing JSON system files used to create and structure the data used in the web map. A coordinated legend and data layer visualization, along with point aggregation using the Leaflet marker cluster plugin are also demonstrated. The code for this web map can be viewed on GitHub.
Languages: JavaScript, HTML, CSS
Libraries: Leaflet, D3.js, Node.js, jQuery, mapshaper
Data Sources:
Stats NZ and
MfE
Data Service
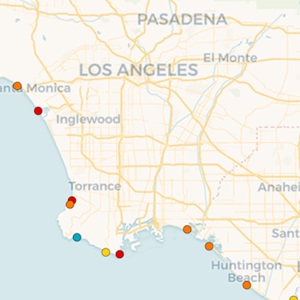
Coastal Vulnerability
This web map visualizes the relative susceptibility of coastal beaches to sea-level rise through the use of a coastal vulnerability index (CVI). The initial classification used in the CVI is based upon geomorphology, regional coastal slope, tide range, wave height, relative sea-level rise and shoreline erosion and accretion rates. The combination of these variables furnish a broad overview where physical changes are likely to occur due to sea-level rise. The code for this web map can be viewed on GitHub.
Languages: JavaScript, HTML, CSS
Libraries: Leaflet, GDAL, ogr2ogr, mapshaper, Node.js
Data Sources: USGS Coastal
Change Hazards Portal and
U.S.
Board on Geographic Names
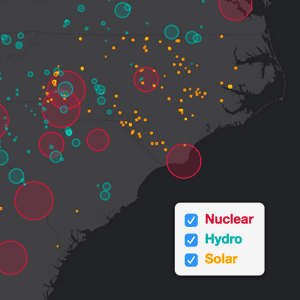
U.S. Power Plants
This interactive bivariate web map displays nuclear, hydroelectric, and solar power plants within the United States, symbolized by fuel source and energy output. The proportional circle symbols indicate the amount of power produced from one fuel source. The user can click any blank area on the map to visually filter power plants within 500 kilometers from the click location, then click on a power plant location circle to display its attributes and distance from the original click point. The code for this web map can be viewed on GitHub.
Languages: JavaScript, HTML, CSS
Libraries: Leaflet
Data Sources: U.S.
Energy Information Administration
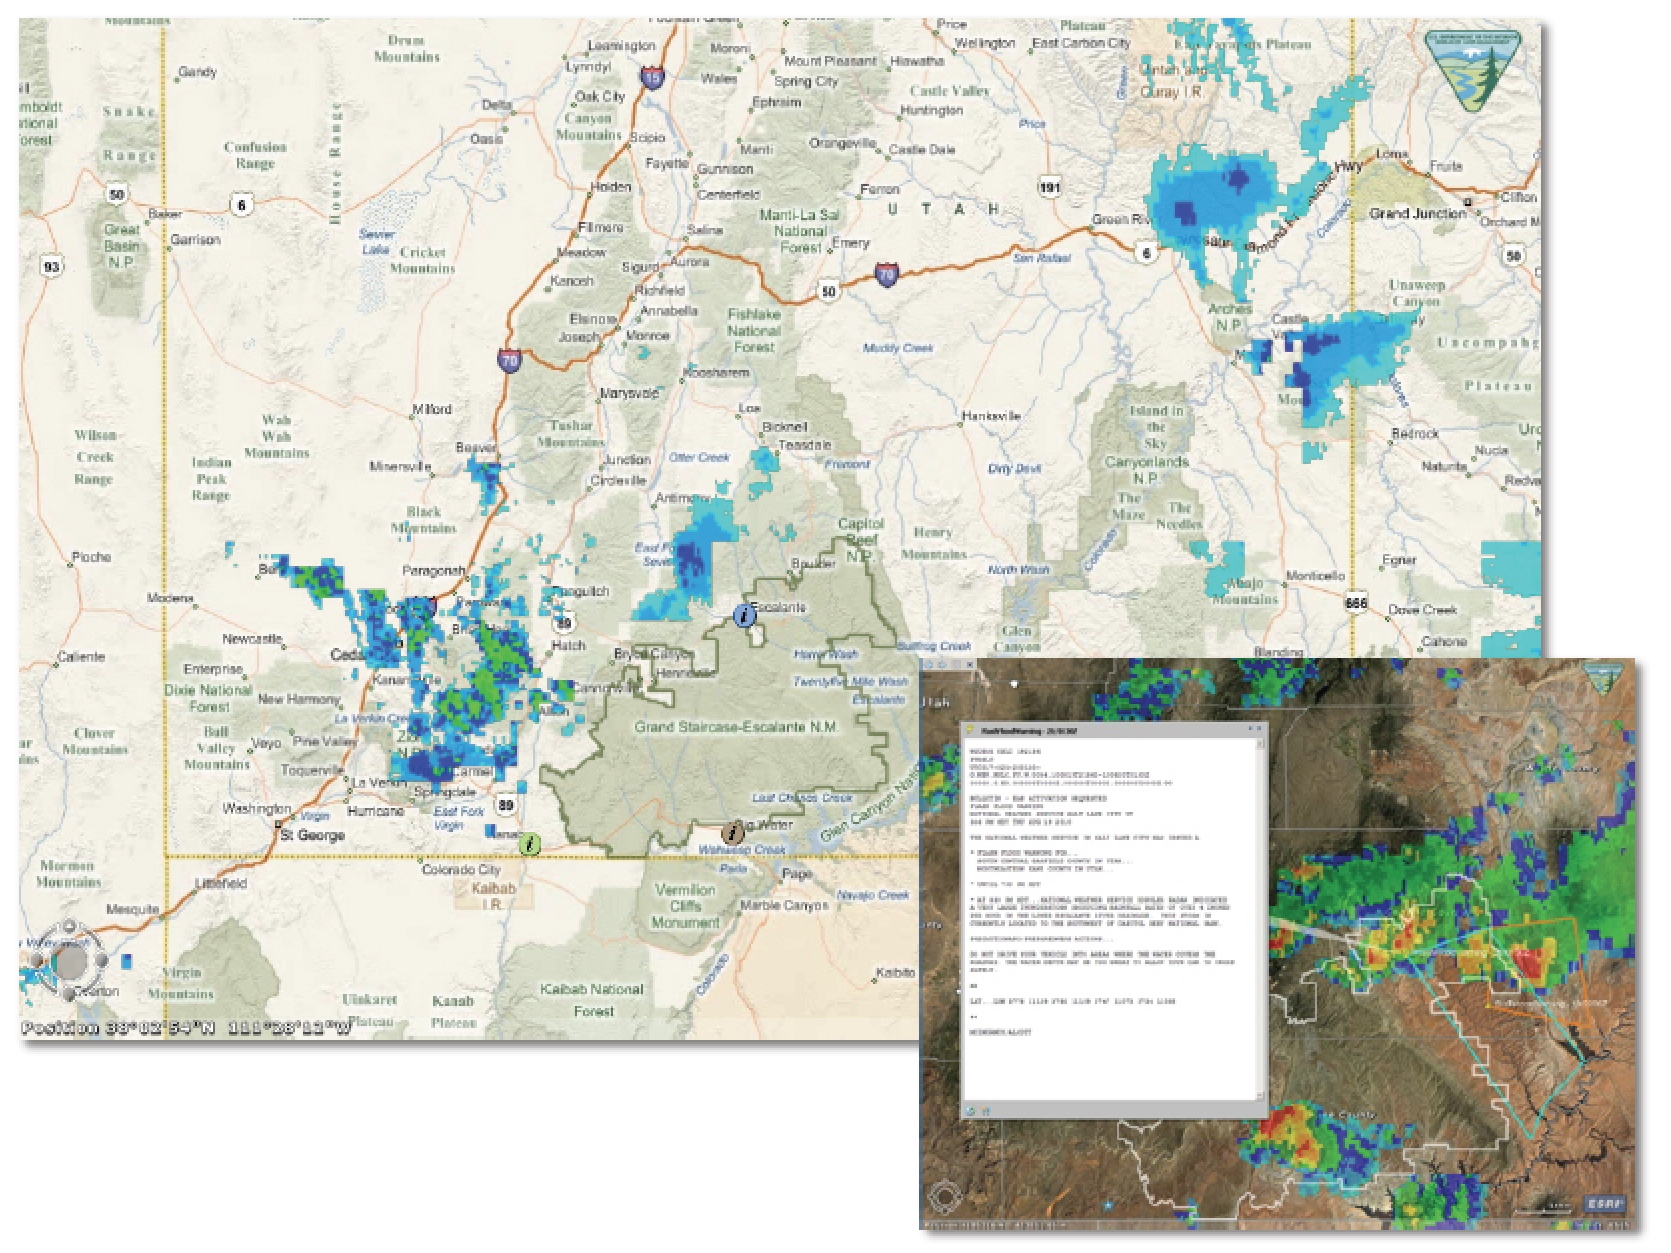
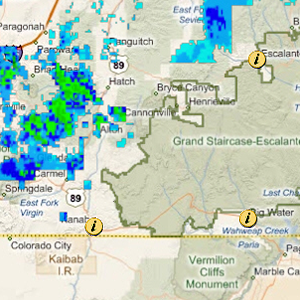
Real-time Visitor Weather App
This live, interactive weather application was designed for the Visitor Information Stations throughout Grand Staircase-Escalante National Monument, Utah. This application hybrid combines GIS, monument data, streaming National Weather Service radar data, weather watches, warnings, and public alerts.
Languages: JavaScript, HTML, CSS
Data Sources: National Weather
Service
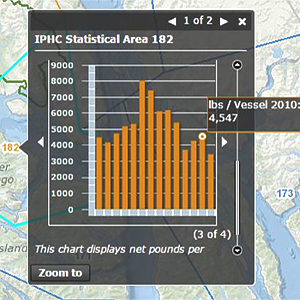
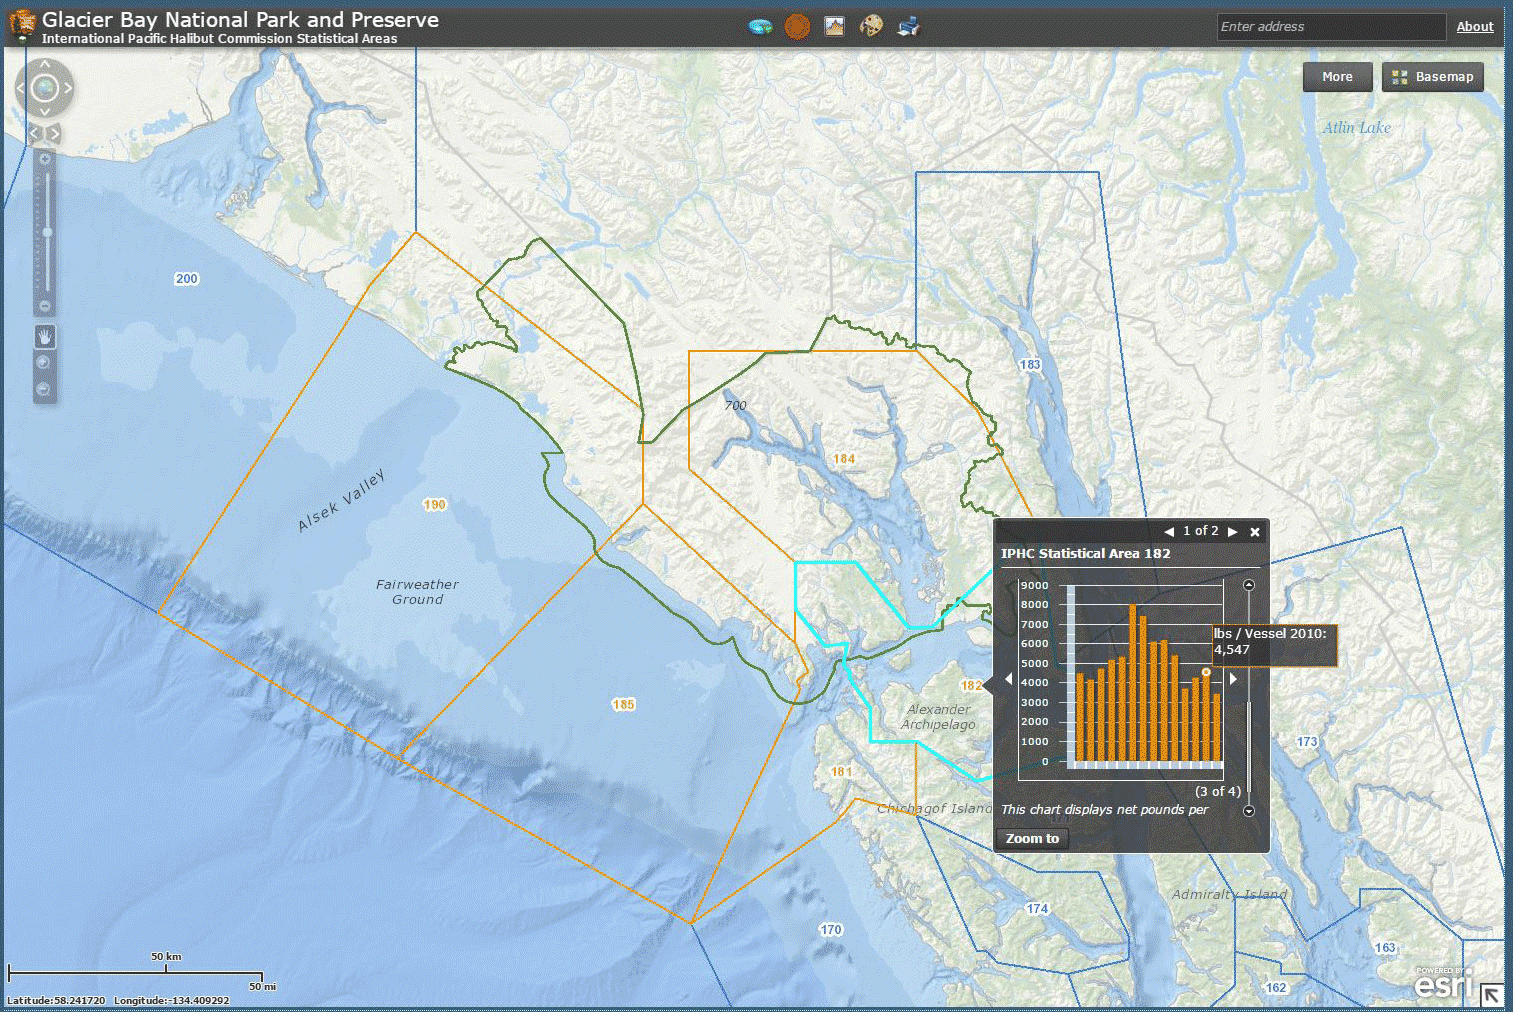
Statistical Harvest Data
The International Pacific Halibut Commission (IPHC) studies the management of the stocks of Pacific halibut within the Convention waters of the United States and Canada. Commercial fishing is still permitted under certain circumstances within Glacier Bay National Park. This screenshot displays an interactive web map developed for the National Park Service that combines both spatial and temporal IPHC statistical harvest data.
Languages: JavaScript, HTML, CSS
Data Sources: International Pacific
Halibut Commission